AI-Powered Financial Chart Analyzer
This intelligent automation workflow streamlines financial chart analysis by utilizing image input from Apple automation tools, advanced algorithmic processing through machine-learning platforms, and real-time financial data from market intelligence APIs. It provides actionable insights and predictive analytics on stock behavior, empowering investors, traders, and financial consultants to make data-driven decisions.
Benefits
Automated Chart Analysis
Processes chart images through AI-enhanced systems, significantly reducing manual workload and interpretation time.
Real-Time Market Insights
Delivers live market insights and price movement trends using data from trusted financial APIs.
Accurate Stock Predictions
Employs predictive models trained on historical and live data to forecast potential stock behavior.
Seamless Integration
Sends predictions and insights via webhooks, allowing integration into financial dashboards or business intelligence systems.
MacOS Shortcut Integration
Enables fast and efficient image input on Apple devices through native automation tools, improving workflow agility.
How It Works
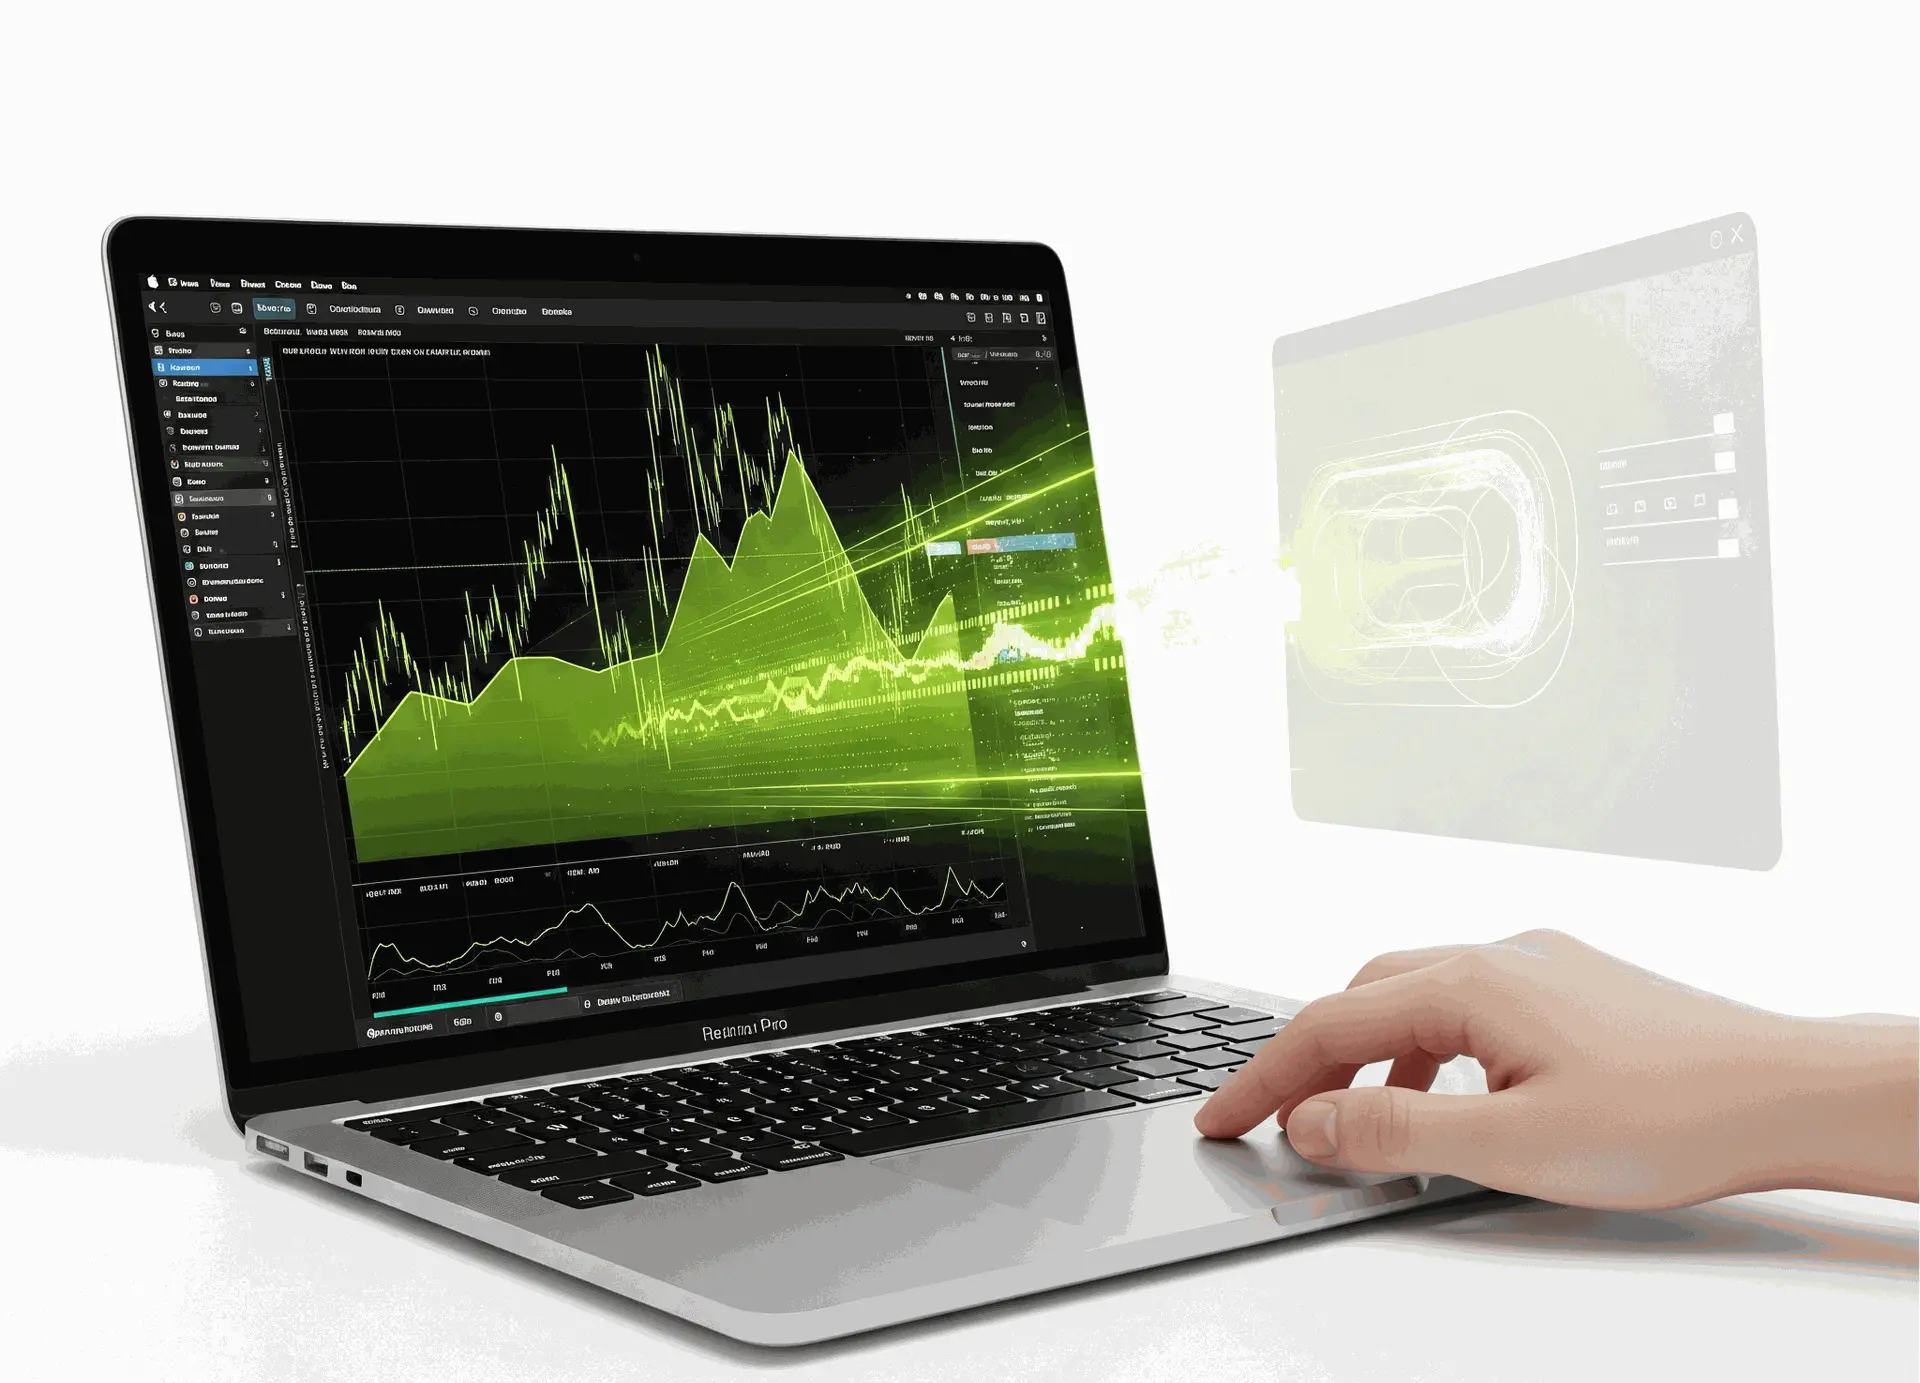
Chart Image Input
Users initiate the workflow by submitting chart images using Apple-native automation functionalities.
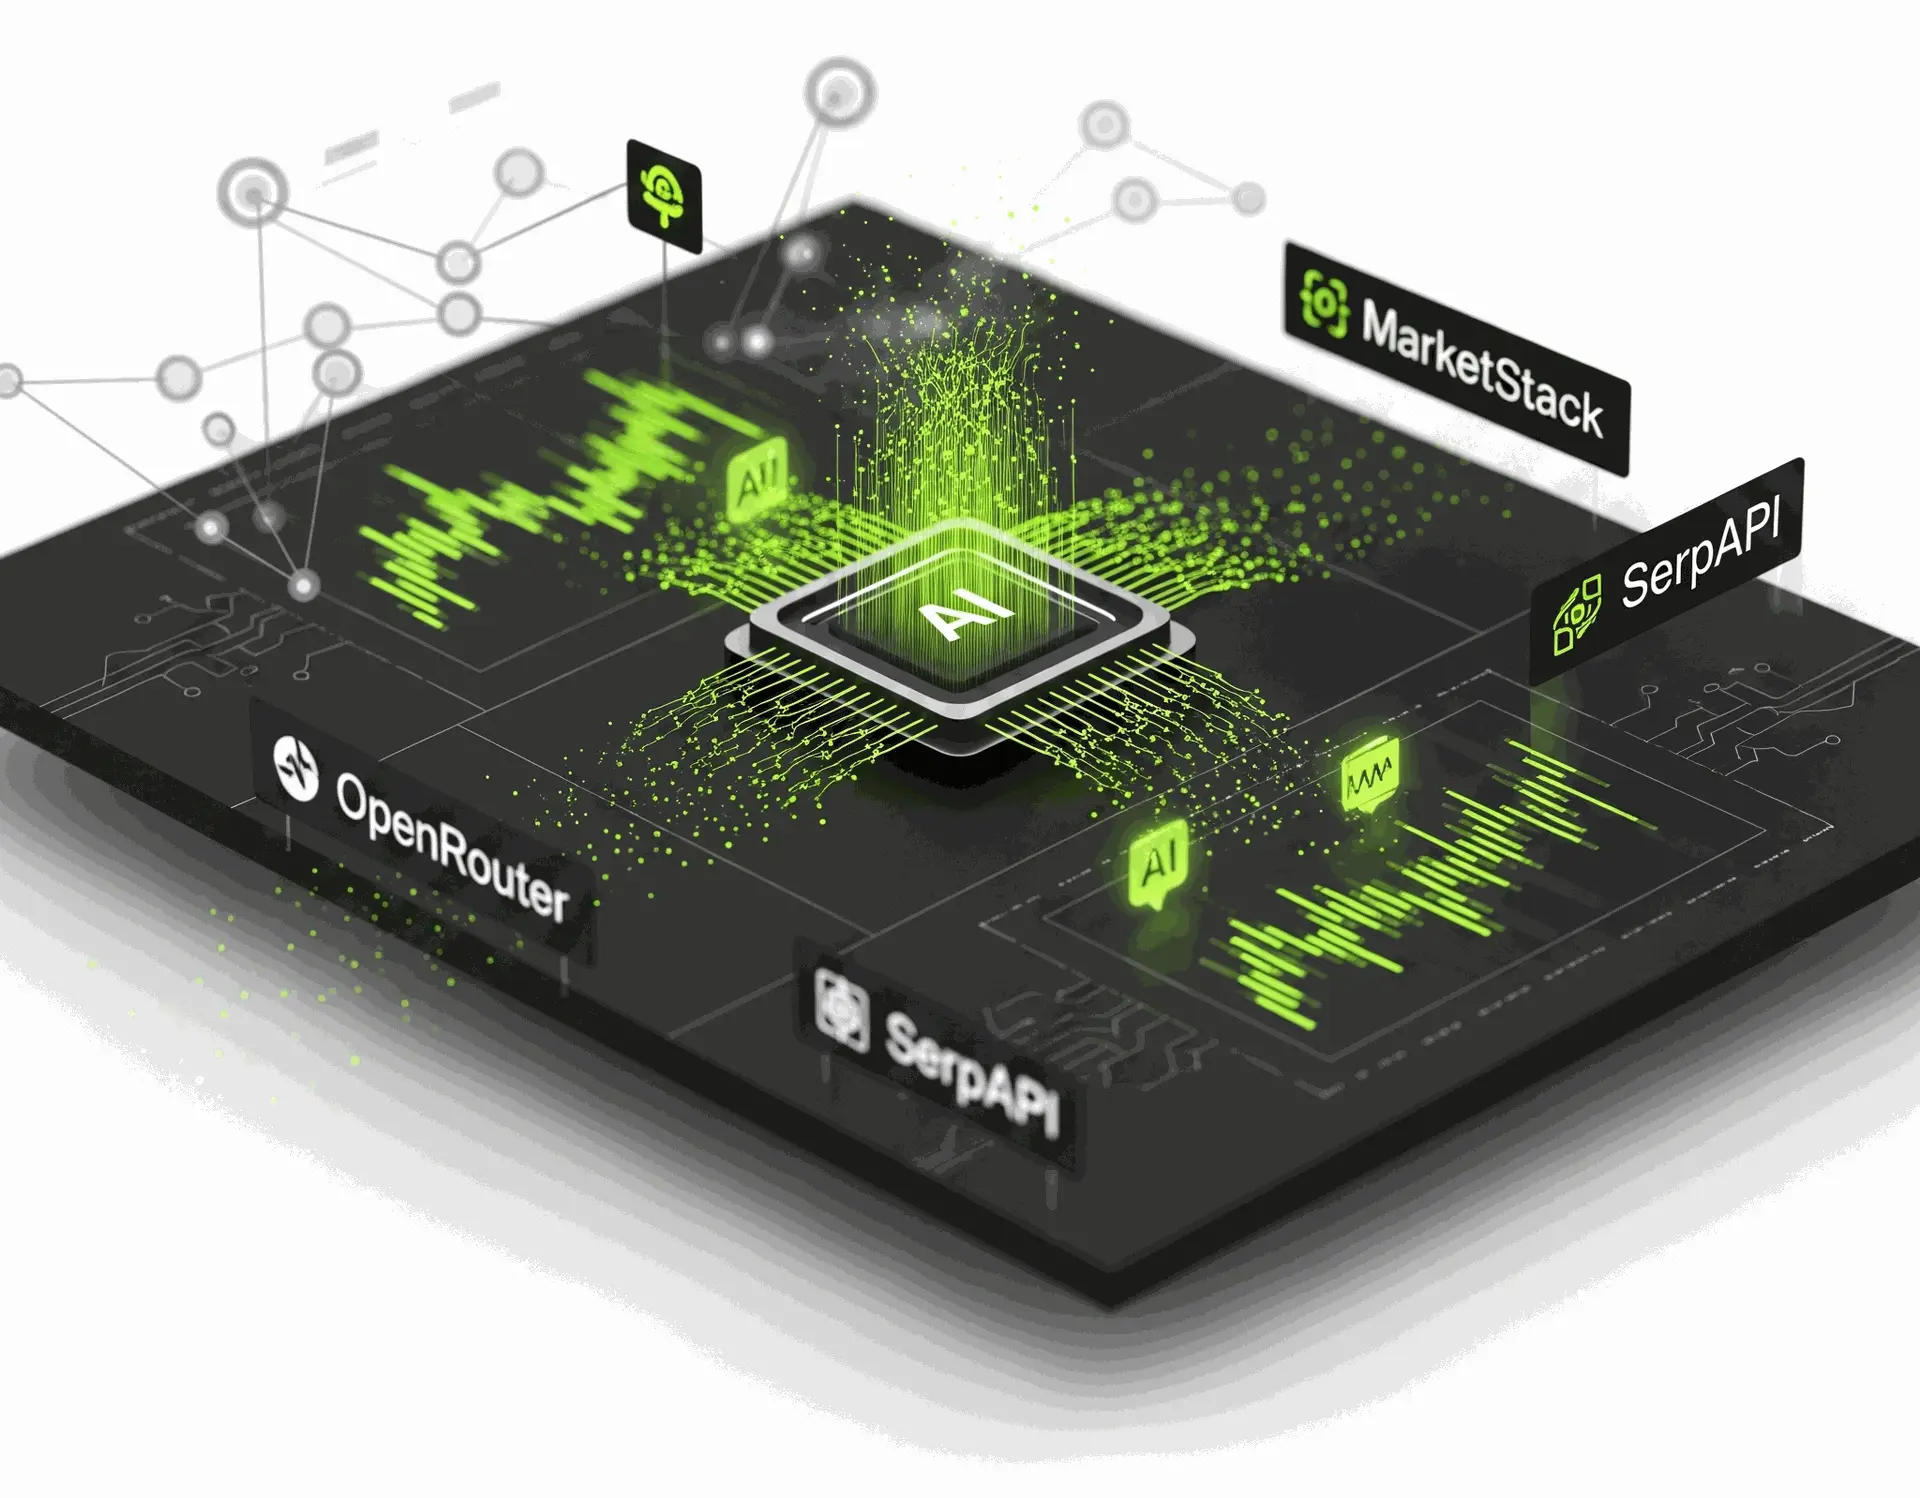
AI Processing
Images are analyzed using predictive algorithms and real-time financial APIs to detect market trends and historical patterns.

Real-Time Analysis
The system cross-references real-time datasets with historical chart data to provide dynamic market assessments.
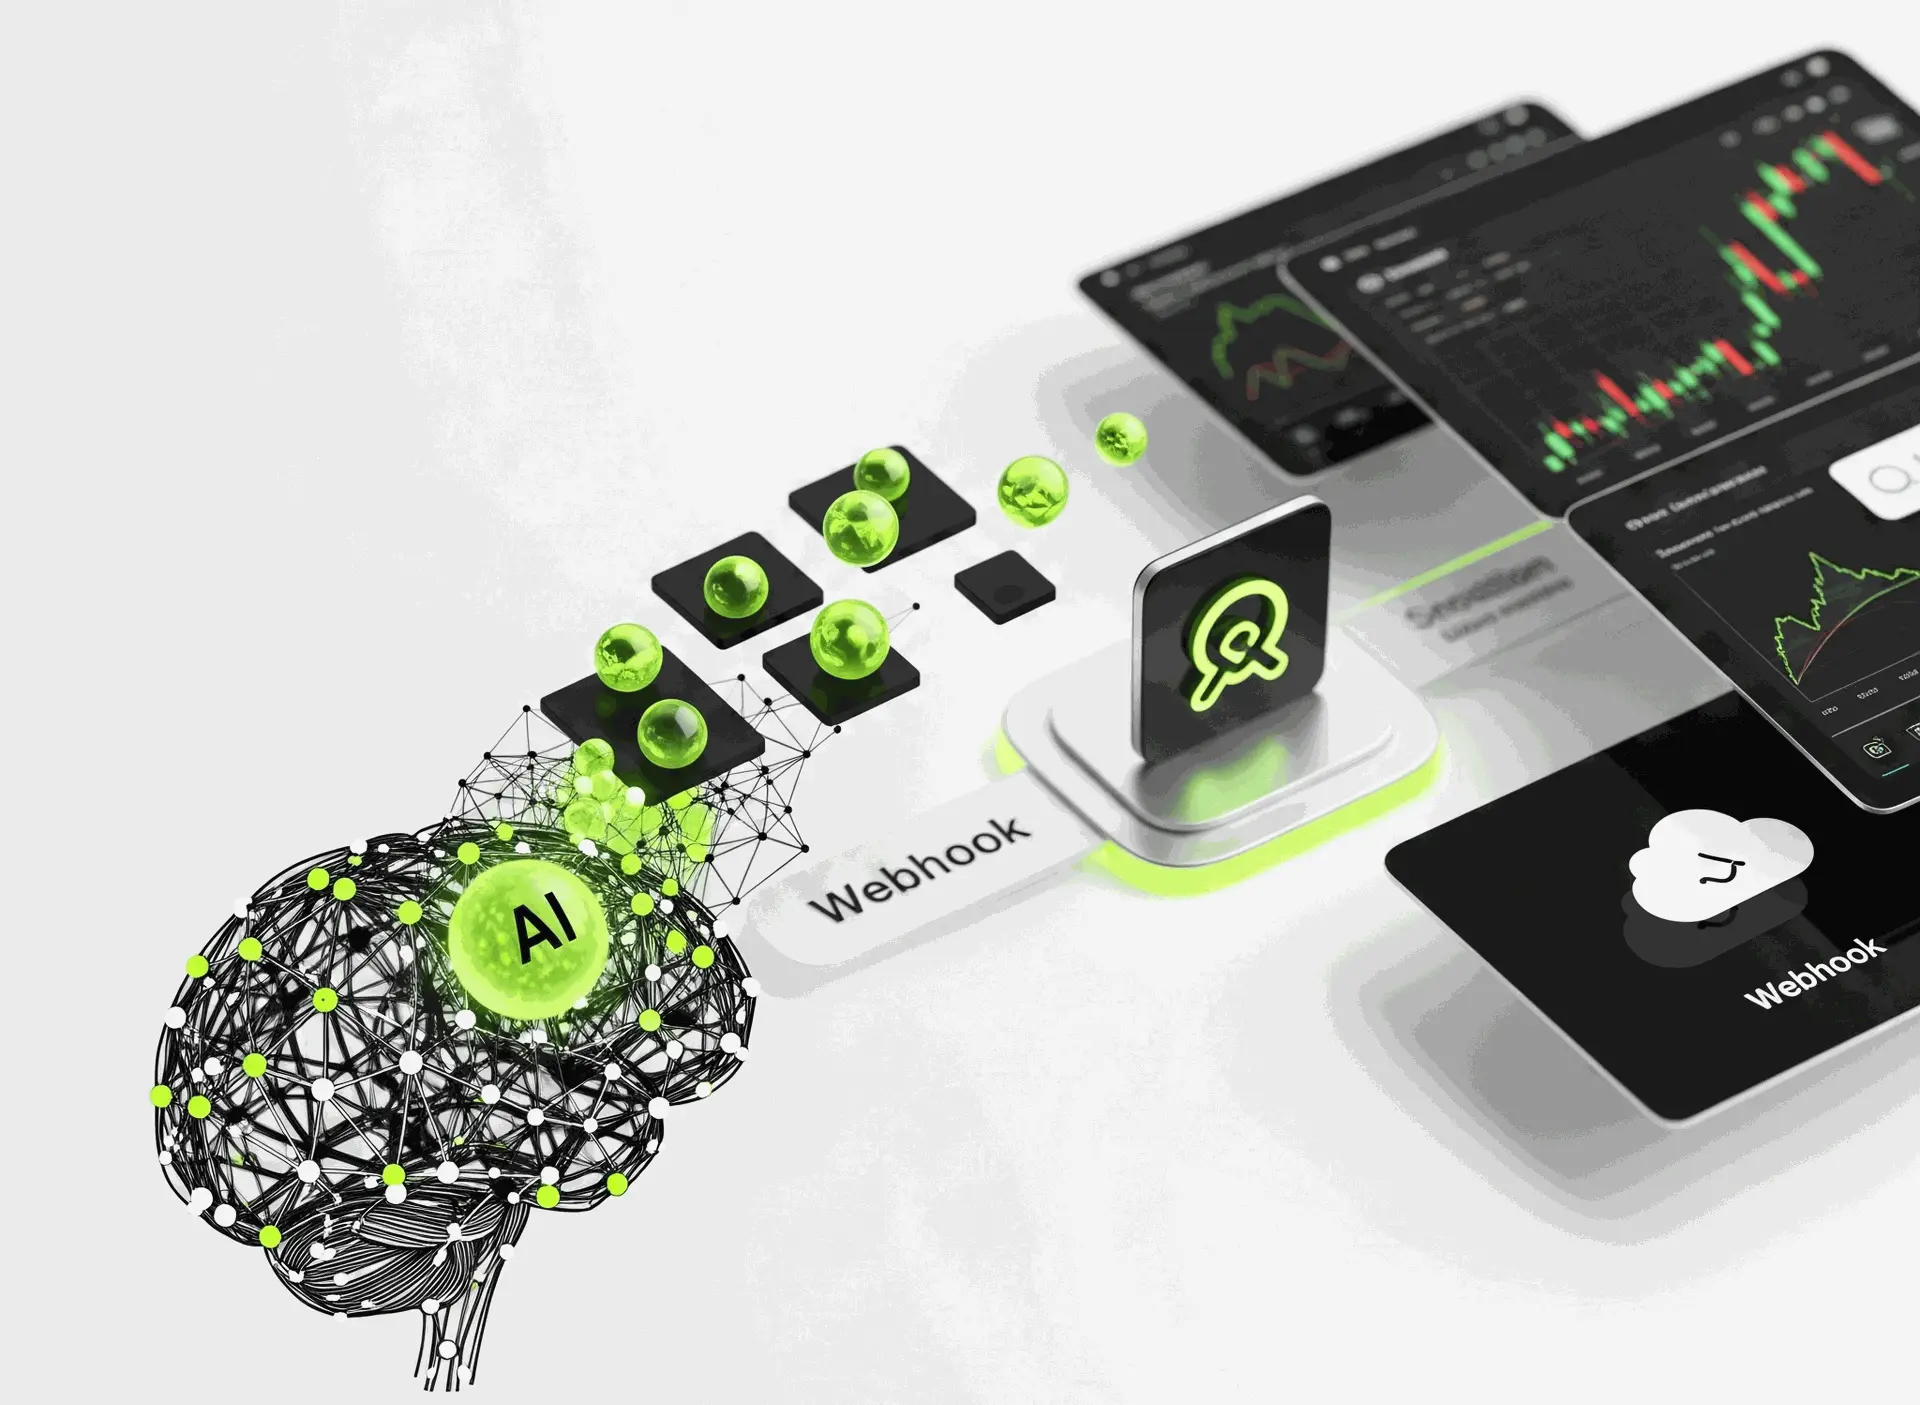
Prediction Delivery
Insights and forecasts are automatically routed via a webhook to integrated platforms, ensuring seamless user access.
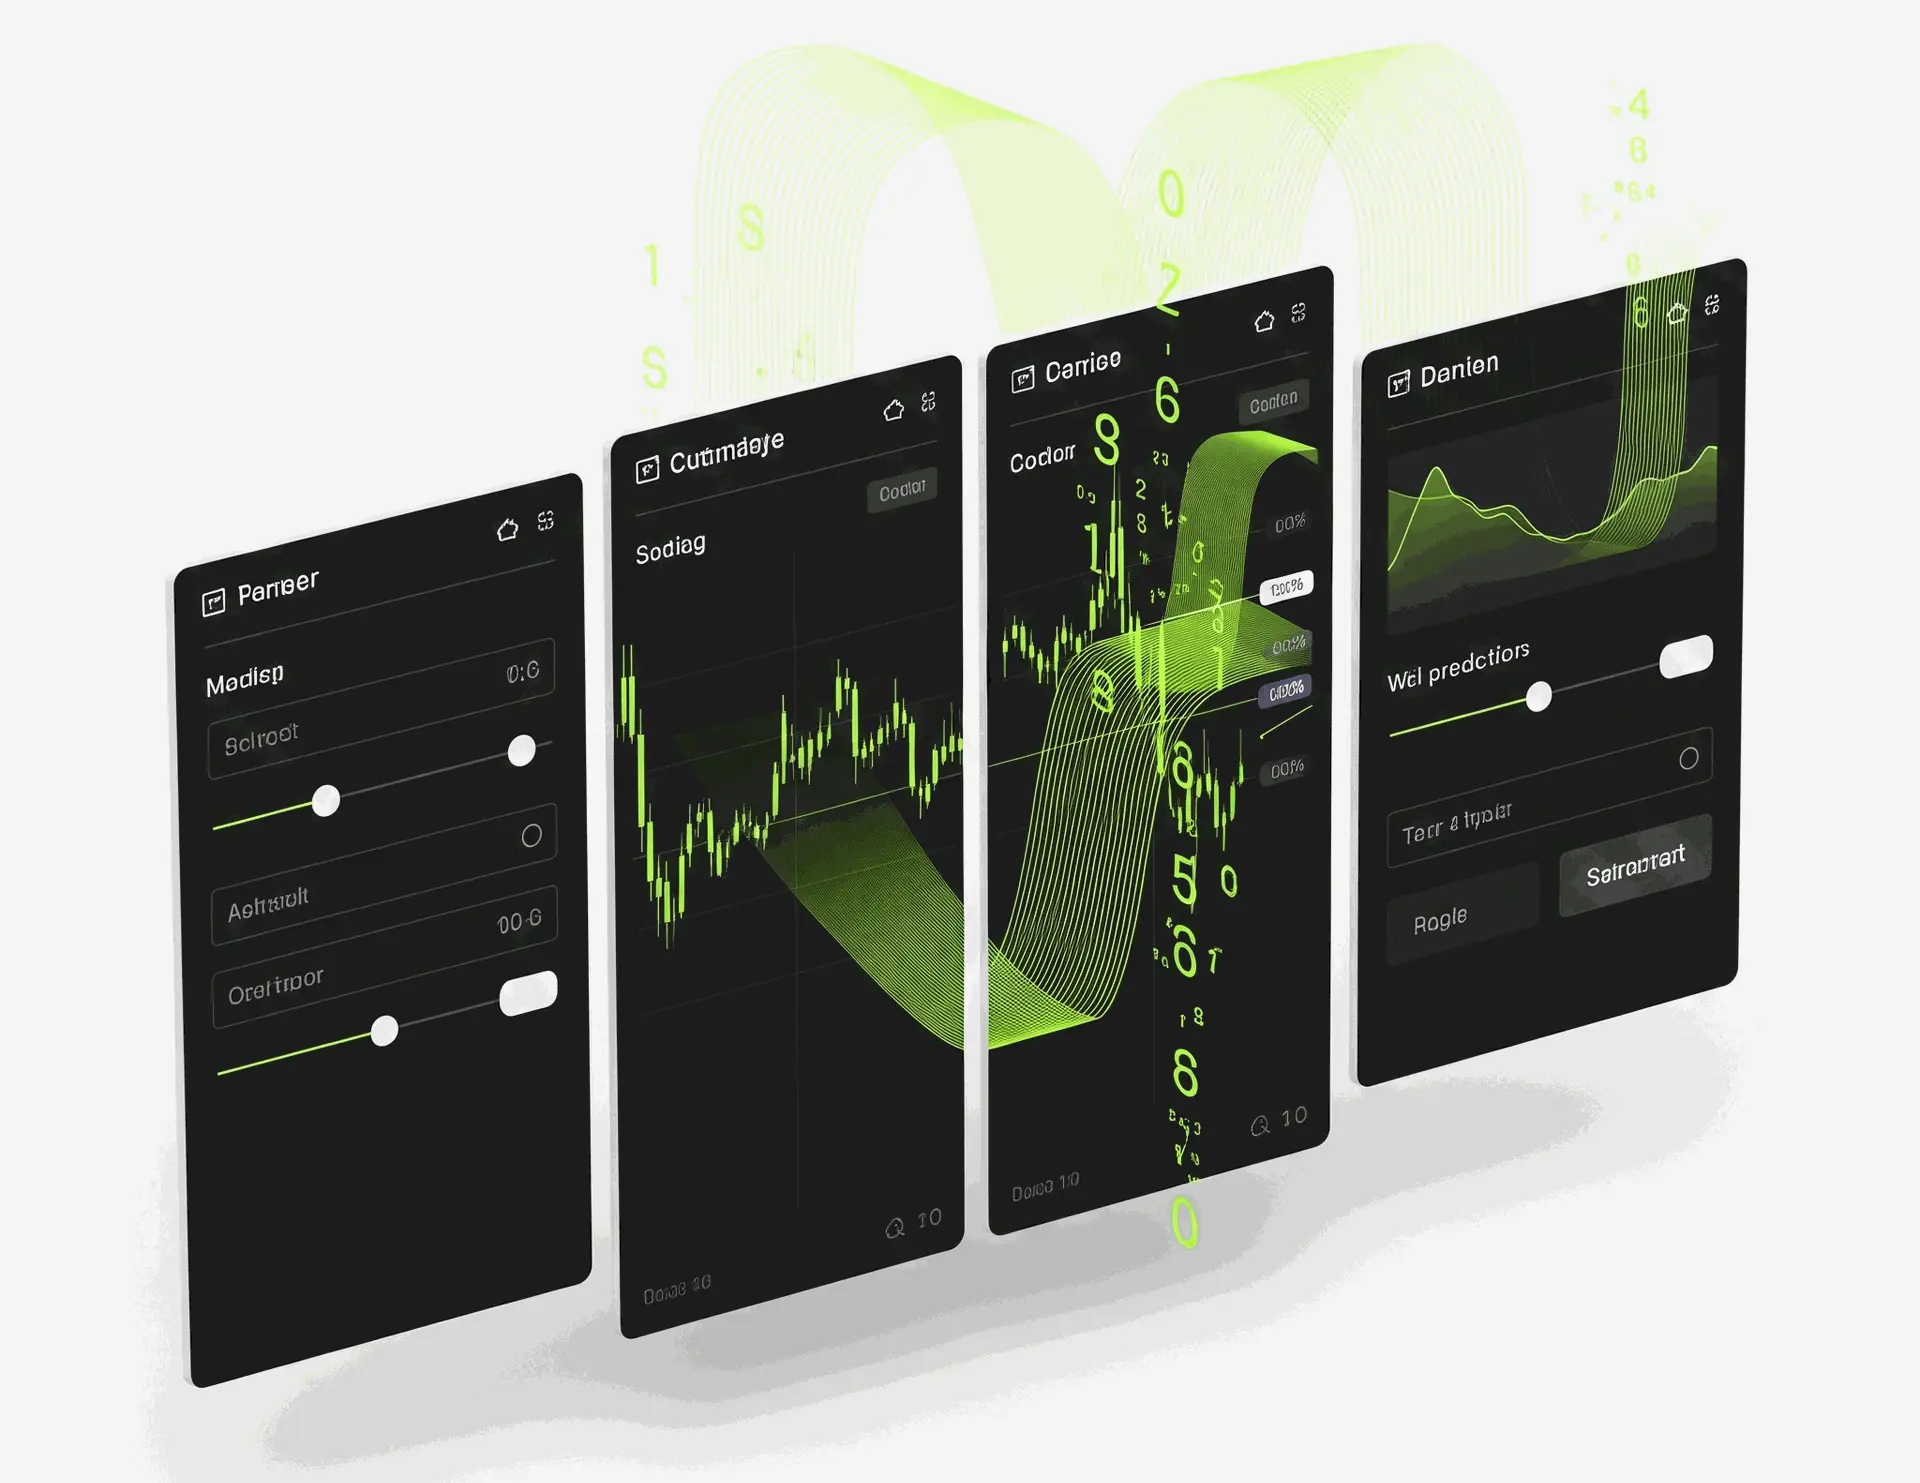
Customization
The solution supports configuration for specific chart types, market segments, or tailored stock prediction models.
Use Cases
Investors and Traders: Automates technical analysis to deliver timely predictions without the need for manual interpretation.
Financial Analysts: Enhances accuracy in market forecasting through AI-powered evaluation of financial indicators.
Financial Advisors: Enables value-added services by providing clients with real-time insights and predictive data.
Integration and Customization
AI Tools Integration
Connects with intelligent analysis APIs to extract meaningful insights from financial chart data.
MacOS Shortcuts
Integrates natively with Apple’s automation tools for streamlined chart uploads and task execution.
Webhook Delivery
Sends predictions and trend analyses to any endpoint, simplifying the connection with other enterprise platforms.
Customizable Workflow
Can be tailored to specific business needs, allowing for the addition of data sources, analytical models, or new output channels.